Vancouver Real Estate Market Update: July 2026 Explained
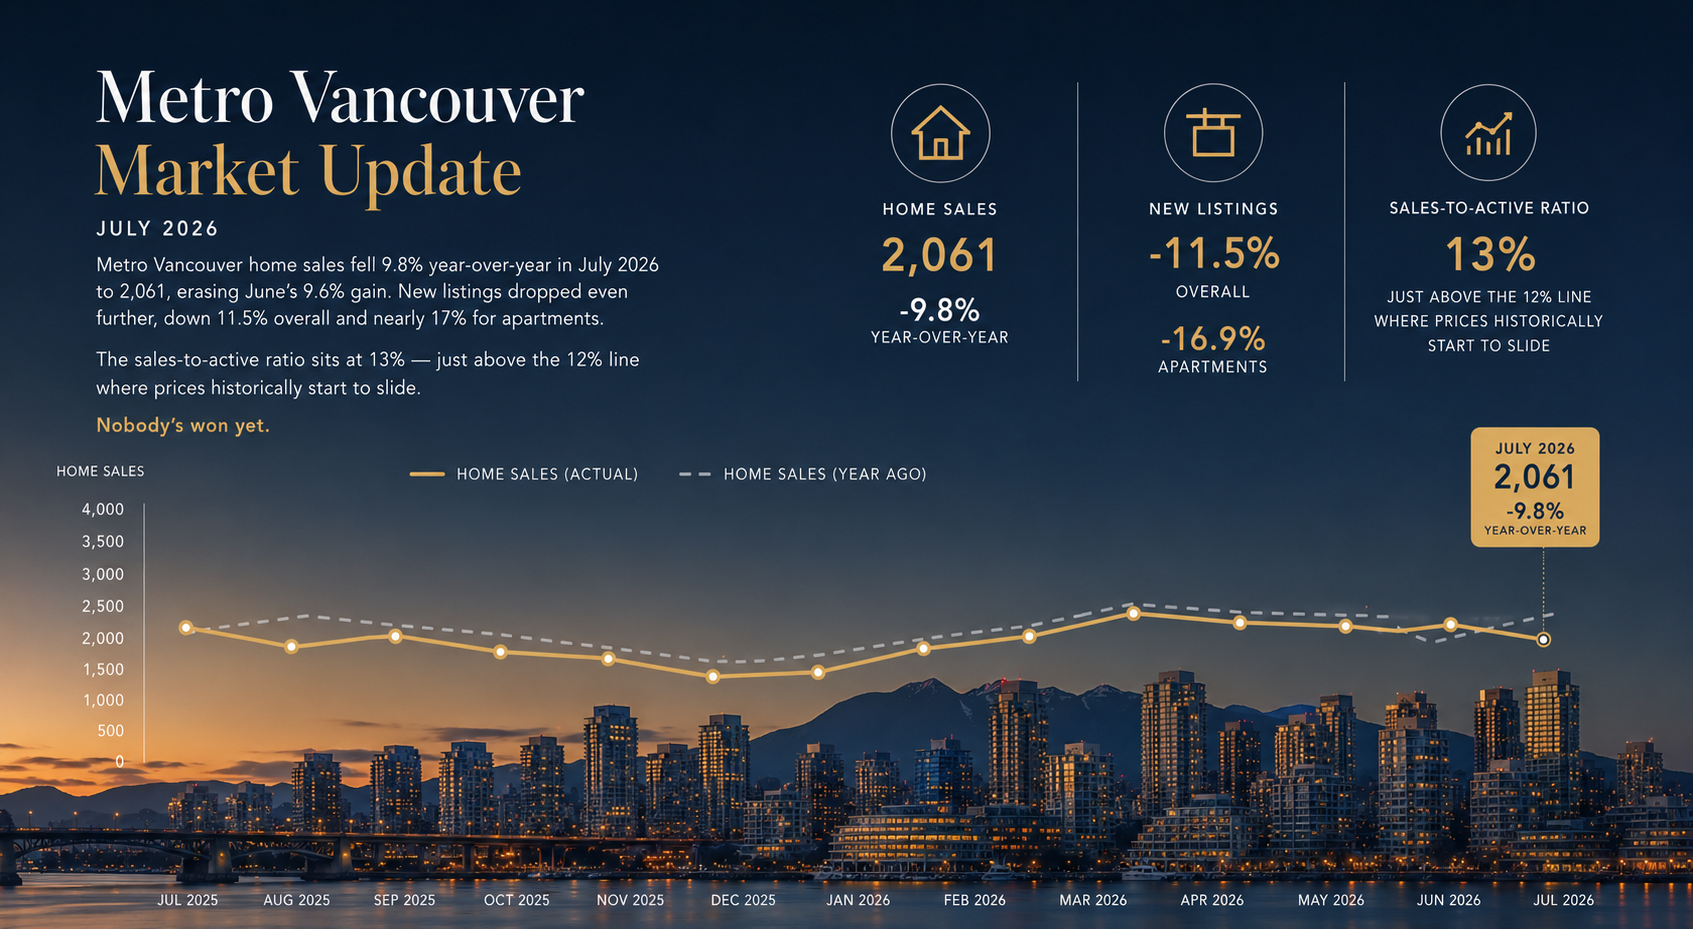

Quick Answer: Metro Vancouver home sales fell 9.8% year-over-year in July 2026 to 2,061, erasing June's 9.6% gain. New listings dropped even further, down 11.5% overall and nearly 17% for apartments. The sales-to-active ratio sits at 13% — just above the 12% line where prices historically start to slide. Nobody's won yet.
June looked like a turning point. Home sales across Metro Vancouver climbed 9.6% year-over-year, and for a minute, it seemed like the market had decided which way it wanted to go. Then July happened. Sales dropped 9.8% — almost the exact same swing, in the opposite direction, one month later.
Here's what most people get wrong about a month like this: they read the sales number and stop. The sales number isn't the story in July 2026. The listings number is.
What actually happened to Vancouver home sales in July 2026?
Residential sales across the Greater Vancouver REALTORS® (GVR) region totalled 2,061 in July 2026, down 9.8% from the 2,286 sales recorded in July 2025, and 18.6% below the 10-year seasonal average of 2,532. Apartment sales led the pullback, falling 17.8% year-over-year to 952. Detached sales slipped a much smaller 3.2% to 639, and attached (townhouse) sales barely moved, down 1.1% to 454.
That gap matters. Condos absorbed nearly all of July's weakness. Houses barely felt it. If you're comparing notes with a friend who bought a townhouse in Coquitlam last month and had a completely different experience than your cousin trying to sell a one-bedroom by Metrotown, that's not a coincidence — it's the data.
Prices moved in the same direction as sales, just quietly. The composite benchmark price for all residential properties in Metro Vancouver is now $1,088,800, down 6.2% year-over-year and 0.9% from June. Detached sits at $1,822,900 (down 7% year-over-year), apartments at $688,000 (down 7.5%), and attached homes at $1,030,400 (down 6%).
Why the drop in new listings matters more than the sales number
Only 4,991 properties came onto the MLS® in Metro Vancouver in July 2026 — an 11.5% decrease from the 5,642 listed in July 2025. Apartment listings drove most of that decline, falling close to 17%.
Sellers are pulling back faster than buyers are. That's the actual headline. A slow sales month with steady new listings just means buyers are cautious. A slow sales month and a shrinking flow of new inventory means the supply side is losing conviction too — and that changes the math for everyone still deciding whether to list.
If this pattern holds for a few more months, the market works through its existing inventory without needing a jump in demand to do it. Fewer new listings plus a steady drip of sales is how a soft market quietly tightens. It's not fast. It's not dramatic. It's the kind of shift that only shows up if you're actually tracking the listings side, not just the sales headline everyone else reports on.
What the sales-to-active ratio of 13% actually means
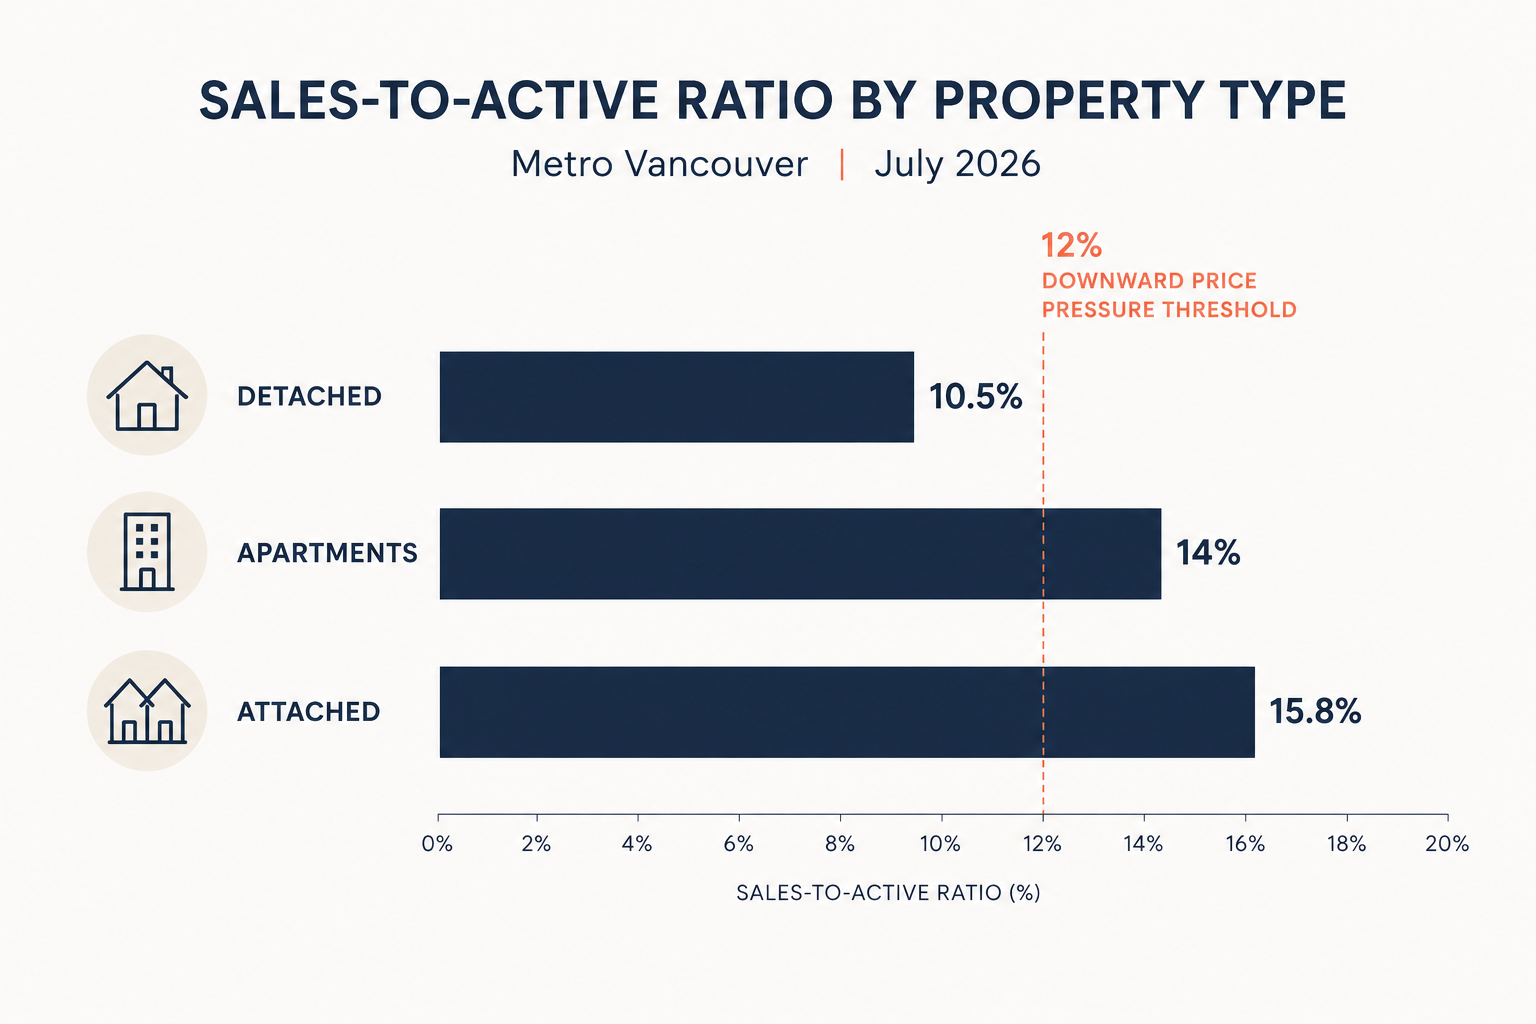
The sales-to-active listings ratio for July 2026 sits at 13% across all property types — 10.5% for detached, 15.8% for attached, and 14% for apartments. Historically, GVR's own data shows prices come under sustained downward pressure once that ratio drops below 12% for several months in a row, and upward pressure tends to build once it climbs above 20%.
Thirteen percent is close enough to that lower line to matter, but it isn't there yet. Detached homes, at 10.5%, are the segment closest to genuine buyer's-market territory. Attached homes, at 15.8%, are the one segment where a seller with a well-priced product still has real leverage.
The number that tells you more than the headline sales figure is the sales-to-active ratio by property type — because "the Vancouver market" isn't one market. It's three, moving at three different speeds.
Richard's Three-Number Market Check
Most market updates hand you a wall of statistics and let you figure out what it means. Here's the shortcut I actually use with clients — three numbers, checked together, every month:
- Sales versus last year. Tells you whether demand is building or fading. On its own, this is the least useful of the three — it's noisy and gets misread constantly.
- New listings versus last year. Tells you whether sellers are gaining or losing confidence. A falling sales number paired with falling new listings is a very different market than a falling sales number paired with rising ones.
- Sales-to-active ratio, by property type — not just the overall number. This is where the real signal lives. It tells you which segment currently favours you, whether you're buying or selling.
Run those three together and July 2026 reads clearly: soft demand, shrinking supply, and a market that's tightening from the inventory side while everyone else is still arguing about the sales headline.
If you're waiting for someone to tell you the market has "turned," you're going to be waiting a while. It's telling on itself right now, one number at a time.
Thinking about what this actually means for your specific street, your specific building, or your specific timeline? Book a no-pressure market conversation →
What this means for you
If you're a buyer, the segment-by-segment breakdown is your leverage. Detached at 10.5% sales-to-active is where negotiating power is real right now — sellers in that segment are competing harder than the headline "soft market" suggests. Apartments are softer on paper, but that 17% listings drop means the deep, easy pickings some buyers are still expecting from six months ago are starting to thin out.
If you're a seller, price and timing matter more than usual, not less. A 13% overall ratio isn't a market that punishes every listing — it's a market that punishes overpriced ones. Attached homes, at 15.8%, still have room to move if you price to where the data actually sits, not where your neighbour sold in 2022.
If you're sitting on the sidelines waiting for certainty, I'd gently push back on that plan. The market's been doing this one-step-forward, one-step-back move for a while now. Certainty isn't coming before opportunity does — for either side.
If none of this maps cleanly onto your situation, that's normal. Aggregate numbers rarely do. That's the actual reason to have a conversation instead of just reading the report.
FAQ
Q: Is Vancouver a buyer's market in 2026? A: Not uniformly. The overall sales-to-active ratio was 13% in July 2026 — close to buyer's-market territory but not firmly in it. Detached homes (10.5%) lean toward buyers, while attached homes (15.8%) are closer to balanced. It depends on the property type and neighbourhood, not the region as a whole.
Q: What is a good sales-to-active listings ratio in Vancouver? A: According to GVR's historical analysis, ratios below 12% sustained over several months tend to bring downward price pressure, while ratios above 20% tend to bring upward pressure. Between those two lines, the market is generally considered balanced.
Q: Why did Vancouver home sales drop in July 2026? A: Sales fell 9.8% year-over-year to 2,061, erasing June's 9.6% gain. GVR attributed most of the decline to apartment sales, which dropped 17.8%, while detached and attached sales held closer to flat.
Q: Are Vancouver condo prices dropping in 2026? A: The apartment benchmark price was $688,000 in July 2026, down 7.5% year-over-year and about 1% from June. Condo listings also fell sharply — down nearly 17% — which could slow further price declines if that trend continues.
Q: Should I wait to buy a home in Vancouver right now? A: That depends on your specific timeline, financing, and target property type more than on the regional headline. Waiting for a clearer market signal has a real cost too — new listings are shrinking, which is usually how a soft market tightens without buyers noticing.
Q: What's the average home price in Metro Vancouver right now? A: The composite MLS® Home Price Index benchmark for all residential properties in Metro Vancouver was $1,088,800 in July 2026, down 6.2% from July 2025.
Q: Will Vancouver listings keep declining? A: New listings have now fallen year-over-year for several consecutive months, led by the apartment segment. If that trend continues, it will gradually tighten the sales-to-active ratio even without a jump in buyer demand — a pattern worth watching over the next two or three months.
Vancouver real estate in 2026 isn't a market you win by guessing which way the headline number moves next month. It's a market you navigate by knowing which of the three sub-markets you're actually standing in. If you want a second opinion on where that is for you, book a 20-minute call →.
About Richard Richard is a Vancouver REALTOR® specializing in helping first-time buyers, move-up families, and downsizers navigate Metro Vancouver's real estate market with clarity and confidence. He takes a strategy-first, education-focused approach to every client relationship — no hype, no pressure, just the numbers and what they mean for you. Learn more | Book a call